What are you looking for?
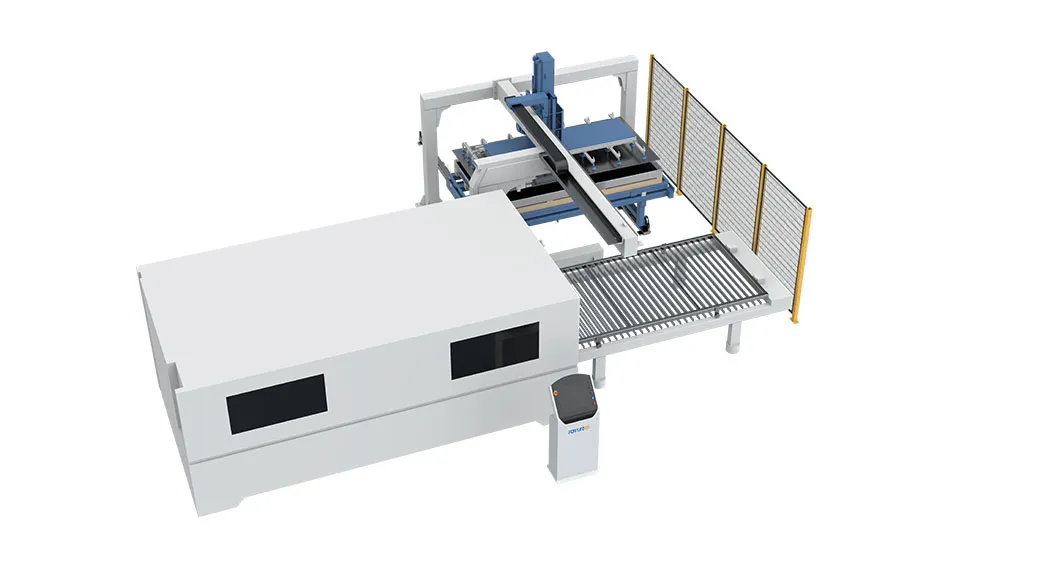
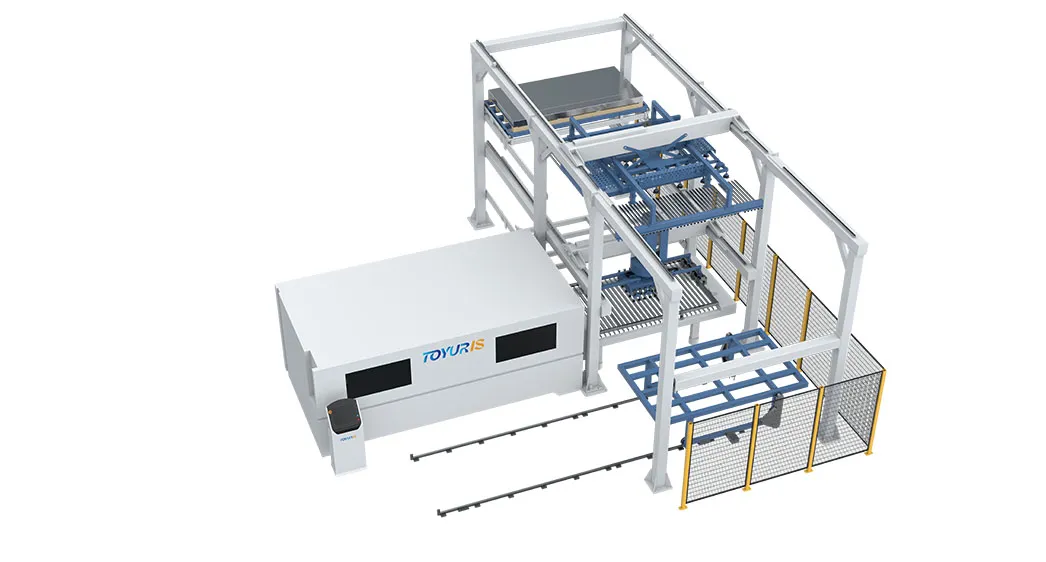
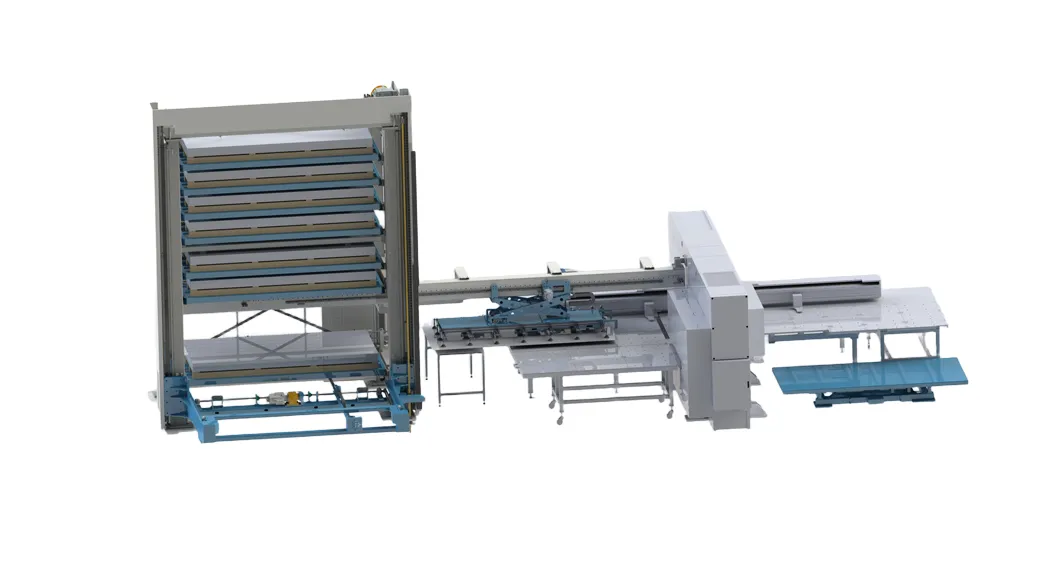
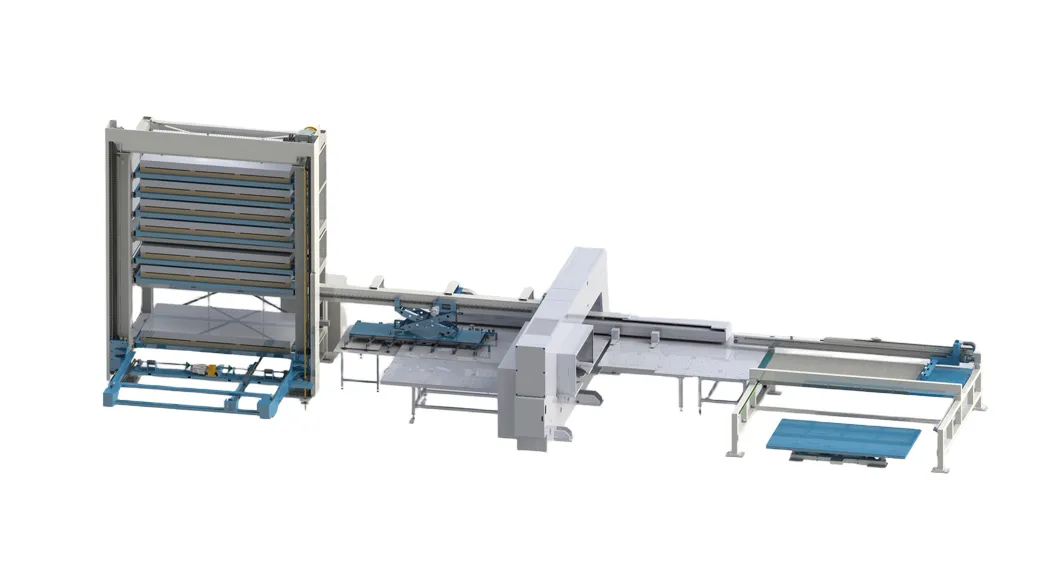
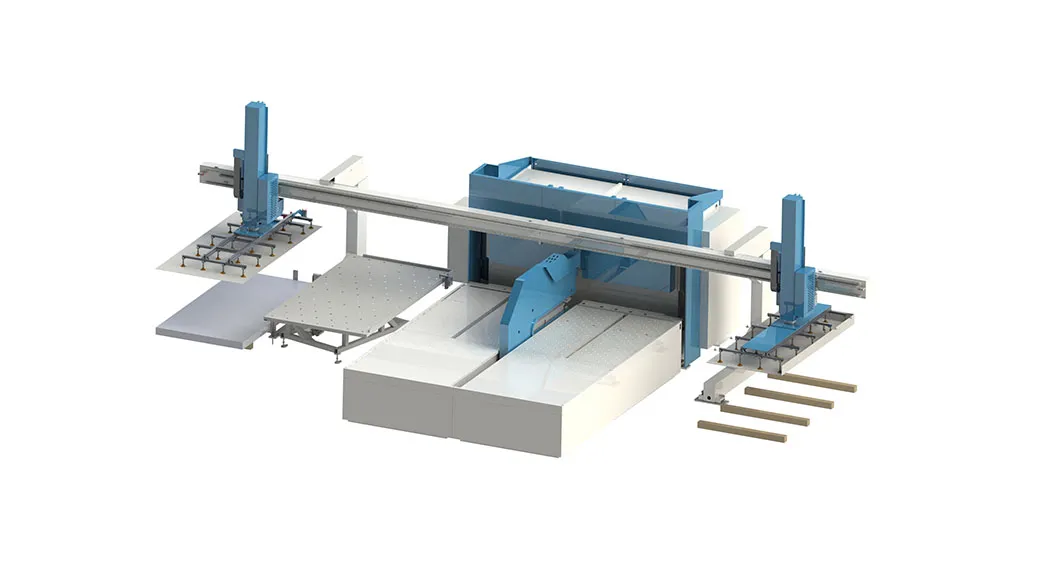
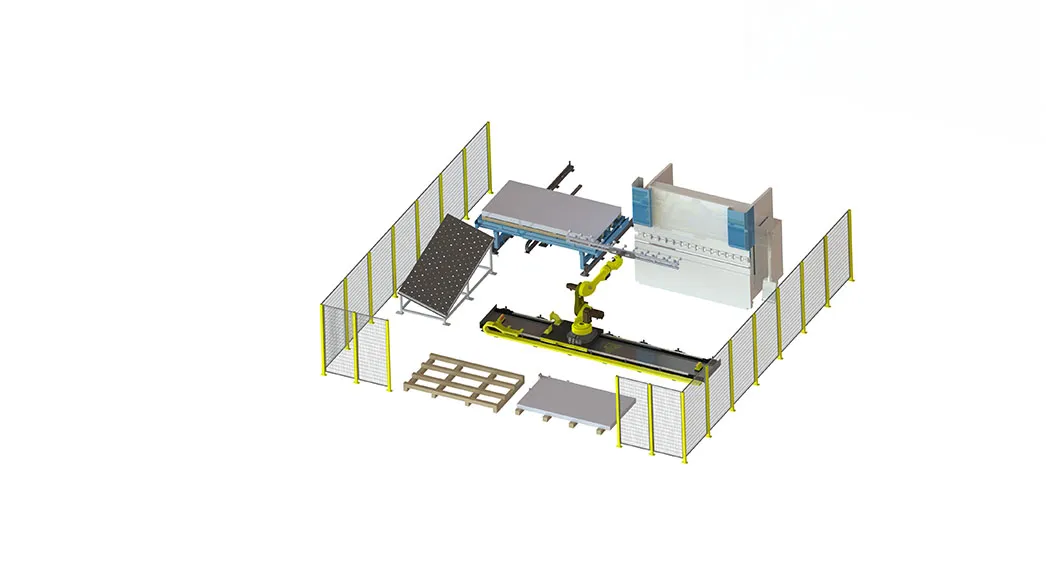
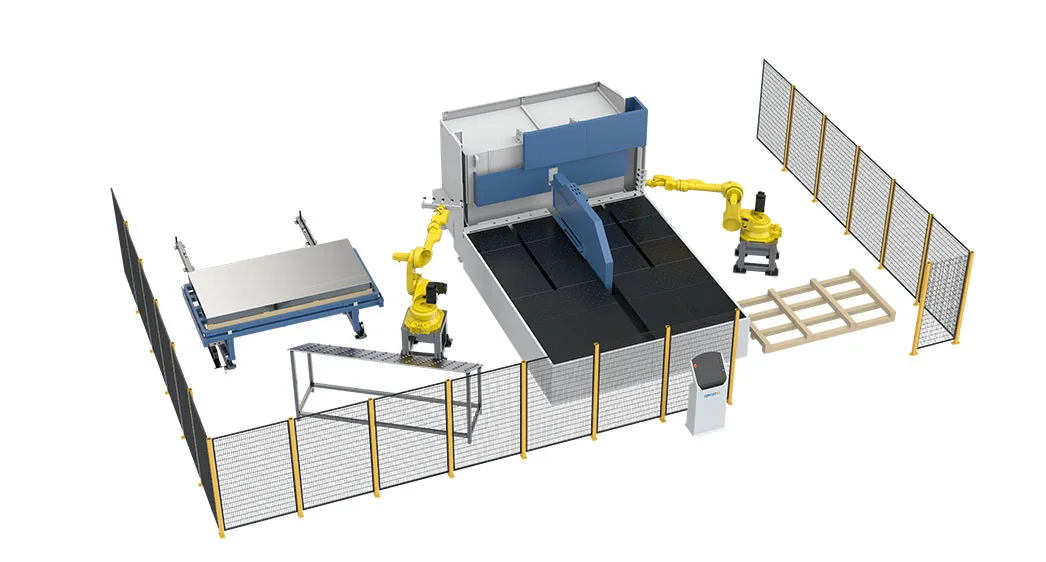
A punch automation project should not be approved because it looks modern, because a supplier promises “high efficiency,” or because labor is generally expensive. It should be approved because the factory can explain where the current losses occur, how much of those losses automation can realistically recover, what the total installed cost will be, and how fast the business will benefit from the result. In other words, the decision needs a structured ROI model.
That model must be practical. Many factories either oversimplify ROI by looking only at machine price and headcount, or overcomplicate it with financial assumptions that are not connected to shop-floor reality. The most useful approach is operational first and financial second. Start with measurable production data, convert recoverable losses into annual value, then subtract the real cost of the automation project and test the result under several scenarios.
This guide provides a step-by-step method to calculate punch press automation ROI, including baseline data, annual savings, capacity value, labor effects, payback, and risk control. It also explains how Toyuris typically helps factories frame the decision. The objective is not to inflate return. The objective is to build a decision case that remains credible after installation.
Punch press automation ROI is the financial return created when an automation project recovers productive time, reduces avoidable operating cost, or increases sellable output enough to justify the total installed investment.
ROI in this context is not just a finance department ratio. It is a translation of factory behavior into business value. When a plant reduces sheet loading delays, part clearing interruptions, overtime, scrap movement, or labor intensity, those operational improvements create measurable effects. Some become direct cash savings. Others become capacity value, which only matters when the plant can actually use the extra capacity for more profitable output or better lead time performance.
It is important to separate what can be measured from what is merely hoped for. A proposal that claims “30% higher efficiency” is not yet an ROI model. An ROI model should identify exactly which losses are expected to shrink, which cost lines will change, what assumptions apply, and what happens if actual improvement is lower than expected. That is why the strongest ROI work begins on the factory floor, not in a spreadsheet template.
Punch press automation ROI must include all project costs, not only the machine price, because the business actually pays for the full installed and operational system.
The equipment quotation is only one part of investment. Typical cost categories include the punch press, automation module, loading and unloading hardware, safety guarding, controls, installation, freight, commissioning, training, spare parts, and internal engineering support. If layout changes are required, site work, utilities, or floor preparation should be added. If the line will connect to software or logistics systems, interface cost should be included as well.
Many ROI studies fail because they compare an incomplete purchase price against a broad set of savings. That creates false confidence. A credible model should use what finance teams often call total installed cost or TIC. Even if some cost items are approximate at the early stage, they should still appear as placeholders. Missing cost categories create a misleading payback period. When the proposed line centers on an automated punch press rather than a manual handling model, every linked system cost should be made visible from the start.
Recurring costs also matter. Maintenance contracts, consumables, periodic spare parts, additional electricity, or extra technical support should not be ignored. They are usually smaller than the initial capital line, but they still affect the annual net benefit. The correct formula is not “gross annual savings divided by machine price.” It is “net annual benefit after recurring cost divided into the total project investment.”
| Cost Category | Typical Examples | Should Be Included? |
|---|---|---|
| Core equipment | Punch press, automation modules, controls | Yes |
| Installation | Freight, rigging, assembly, commissioning | Yes |
| Site preparation | Power, air, floor work, layout changes | Yes |
| Training | Operator, maintenance, programming training | Yes |
| Integration | MES, logistics, software communication | Yes if applicable |
| Startup losses | Ramp-up, testing material, temporary reduced output | Yes |
| Recurring support | Maintenance, service, spare parts, energy | Yes as annual cost |
The most important baseline production numbers are those that show how much time, labor, and output the current punch process actually loses during normal operation.
Factories often already measure machine run time, but ROI requires a broader baseline. At minimum, the team should record scheduled hours, actual punching hours, loading delays, unloading delays, operator wait time, changeover time, quality stops, part sorting interruptions, and any queue caused by missing material or unclear scheduling. If the project is intended to solve labor pressure, overtime hours and staffing difficulty should also be measured.
A good rule is to gather at least two to four weeks of representative data. Use ordinary production, not a special “best behavior” week. Segment the data by shift if performance differs meaningfully. A machine that looks productive on day shift may lose much more time at night because supervision, material staging, or operator availability changes.
One extremely useful measure is full system cycle time. If the punch process takes 4 minutes but the total sheet cycle is 7 minutes because of handling and clearing, the factory knows that 3 minutes are part of the automation opportunity. Another strong measure is the percentage of scheduled hours lost to recurring causes. Suppose a machine is scheduled for 4,000 hours per year but loses 600 hours to handling-related interruptions and minor delays. That 600-hour pool becomes the starting point for any recovery estimate.
Annual capacity value is the financial value of productive machine time that automation can recover and that the factory can actually use for sellable work or avoided overtime.
This is where many ROI calculations become either too aggressive or too conservative. The wrong way is to assume that every recovered minute becomes full-margin revenue. The correct way is to ask whether the punch press is truly constrained and whether additional output can be sold, absorbed, or converted into another measurable benefit such as shorter lead time or reduced overtime.
Consider an illustrative example. A punch press is scheduled for 4,000 hours per year. Baseline analysis shows that 500 of those hours are lost to sheet handling, loading delays, and part clearing. The automation project is expected to recover 55% of that loss. Recoverable time is therefore 275 hours. If the machine is the true production bottleneck and each productive machine hour contributes $180 in contribution margin, the annual capacity value is $49,500. If the plant cannot use all of that time for new profitable output, the value should be reduced accordingly.
In some factories, the safer valuation method is avoided overtime. Suppose the plant regularly spends $42,000 per year on punch-related overtime and automation is expected to eliminate 60% of it. The annual value becomes $25,200. This may be more defensible than a full contribution-margin model when demand is uncertain. The best ROI work often shows both calculations and then chooses the more conservative one as the decision baseline.
Factories that are building broader line balance should also compare how extra punching capacity interacts with laser cutting automation, bending, or welding. If punching output rises but the next process is already overloaded, the extra capacity may not create immediate financial return unless the entire flow is considered.
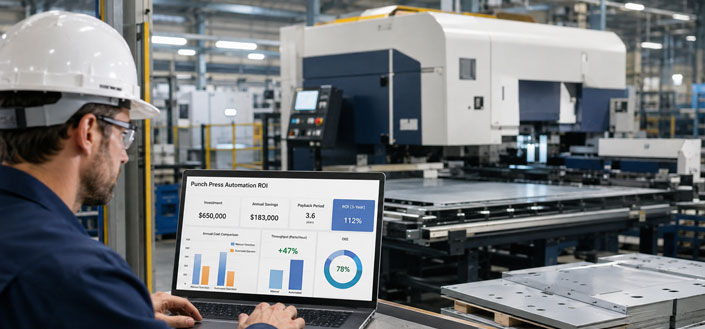
Labor savings should be calculated from realizable changes in staffing, overtime, or reassignment, not from a simplistic assumption that every automated task removes a full salary.
In many projects, automation reduces repetitive handling and allows one operator to supervise more value. But that does not automatically mean payroll shrinks by one full person. Labor value can appear in several forms: reduced overtime, reduced dependence on temporary labor, avoidance of a planned hire, reassignment of employees to bottleneck areas, or improved shift coverage with the same team. The model should state exactly which of these applies.
Suppose a factory uses two people around the punch process on a two-shift pattern and spends $18,000 annually on overtime related to schedule recovery and handling delays. If automation allows the same volume to run with 50% less overtime, the direct annual saving is $9,000. If management also avoids hiring one additional helper that would otherwise cost $28,000 annually, the total labor benefit becomes $37,000. If no direct payroll or overtime reduction occurs, labor may still deliver strategic value, but that value should be presented separately rather than disguised as cash savings.
Labor modeling should also include learning curve effects. During ramp-up, the line may temporarily require extra supervision. A realistic ROI study should treat that as a short-term cost or reduced first-year benefit rather than assuming perfect deployment on day one.
Material, quality, and process savings come from lower damage, fewer handling errors, better cycle stability, and improved process discipline, but they should be based on records rather than generic percentages.
These savings are often smaller than capacity recovery, yet still meaningful. If sheets are frequently scratched, misloaded, lost in queues, or delayed because of unclear handling responsibility, automation may reduce these problems. The right method is to calculate the plant’s current annual cost of each issue and apply a conservative reduction factor.
For example, if handling-related sheet damage and part mix-up currently cost $12,000 per year and the project is expected to cut those losses by 40%, the annual quality/material benefit is $4,800. If scrap movement inefficiency, remnant confusion, or rework due to sequence error costs another $8,000 and automation could remove 25% of it, the added value is $2,000. Together they create $6,800 in annual benefit. Those figures are not dramatic, but they are far more credible than unsubstantiated “quality improvement” claims.
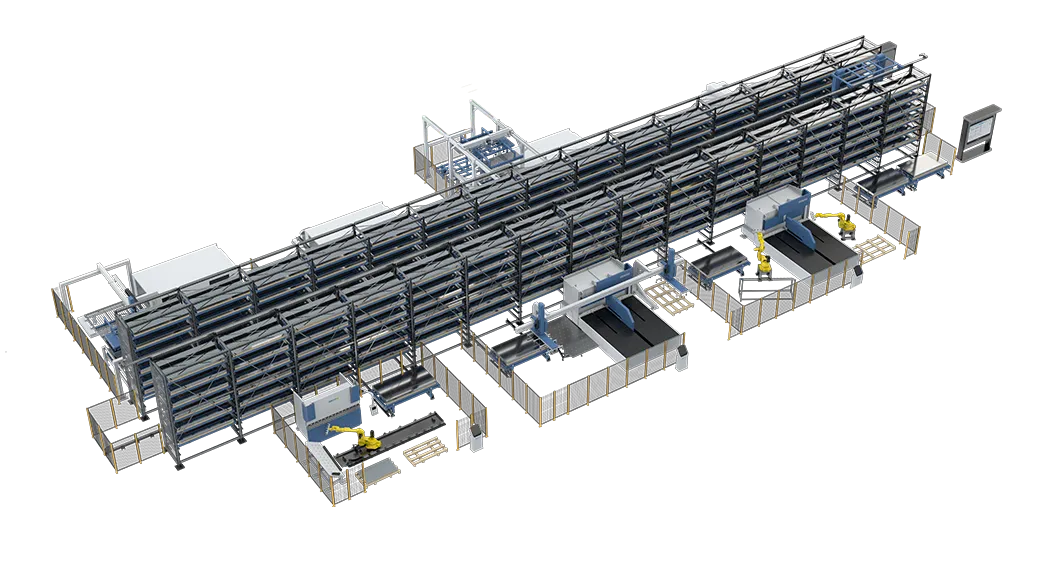
Process savings may also include less production waiting because of more predictable sheet staging. This can be especially valuable when the punch operation is linked to a broader automated warehouse system or digital production schedule. When raw sheet logistics become more controlled, schedule adherence often improves even if the punching cycle itself remains similar.
Payback and ROI are calculated by dividing the total project investment by the annual net benefit, and by comparing cumulative benefit against the original investment over a defined period.
The sequence is straightforward:
Calculate total installed project cost.
Calculate annual gross benefit from recovered capacity, labor effect, overtime reduction, and quality/material savings.
Subtract recurring annual cost such as maintenance or support.
Use the result as annual net benefit.
Payback period = Total Investment / Annual Net Benefit.
Simple 3-year ROI = (3-Year Net Benefit – Total Investment) / Total Investment.
Illustrative example:
Total installed project cost: $640,000
Recovered capacity value: $49,500
Labor and overtime benefit: $37,000
Quality and process savings: $6,800
Gross annual benefit: $93,300
Recurring annual cost: $11,500
Net annual benefit: $81,800
Payback = $640,000 / $81,800 ≈ 7.8 years.
Three-year simple ROI = (($81,800 × 3) – $640,000) / $640,000 ≈ –61.7%.
At first glance this result may seem weak, which is exactly why honest ROI work matters. The factory may then decide to narrow the automation scope, connect the project to a larger capacity plan, or defer the investment. Alternatively, if the business can prove stronger recoverable output or higher overtime avoidance, the result may improve significantly. The point is not to force a positive number. The point is to identify whether the project is justified under realistic assumptions.
Hidden costs and common mistakes distort ROI when teams ignore ramp-up, exclude support systems, overvalue recovered capacity, or count soft benefits as if they were immediate cash savings.
One frequent mistake is double-counting. For example, if recovered productive time is already valued as added profitable output, that same time should not also be counted fully as overtime reduction unless the model explains which part of the time replaces overtime and which part creates new production. Another mistake is ignoring project disruption. Installation, debugging, training, and process tuning take time, and first-year output may be below steady-state potential.
Teams also tend to forget that more automation adds more components to maintain. Preventive care, spare parts, and support training should appear explicitly. If the line requires better material discipline, additional staging or digital control effort may also be needed. These are not reasons to reject automation. They are reasons to build a realistic total-cost view.
The safest discipline is to separate direct cash savings, avoided cost, and strategic operational benefits into different rows. That way, management can see what the project must achieve to make financial sense and what benefits are valuable but less certain.
Scenario analysis improves punch press automation ROI because it shows whether the investment still works when recoverable benefits are lower than the supplier’s ideal case.
At minimum, every serious ROI study should include a conservative case, an expected case, and an upside case. The conservative case might assume lower time recovery, no revenue expansion, and only a portion of labor benefit. The expected case would use validated baseline assumptions and confirmed commercial demand. The upside case may include longer unattended runs, stronger throughput recovery, or growth that depends on additional punch capacity.
For example, a conservative case might value only avoided overtime and a limited portion of capacity recovery. The expected case might add proven demand for more output. The upside case might assume the plant also reduces weekend work and supports a new customer program. If the project fails badly even in the expected case, management should re-scope it. If it works only in the upside case, the project is risky. If it remains acceptable in the conservative case, confidence is much higher.
This scenario method also improves supplier communication. Rather than arguing over a single efficiency number, both sides can discuss assumptions openly: which losses are recoverable, what utilization level applies, and what operational changes must happen for the return to materialize.
Toyuris builds an ROI study by linking project scope to the customer’s actual production losses, factory layout, product mix, and business priorities instead of relying only on generic equipment claims.
That means the discussion normally starts with baseline facts: current shift model, order mix, material characteristics, handling pattern, staffing, overtime pressure, and target output. From there, Toyuris can help estimate which level of punch automation is worth studying. In some plants, a simpler load/unload configuration may deliver most of the recoverable value. In others, stronger integration with logistics or digital control creates the better case.
Buyers should request clear commercial boundaries. Does the proposal include guarding, pallet positions, unloading, software interface, FAT, SAT, and operator training? What first-year support is assumed? Which downtime categories are excluded from availability claims? These details matter more than polished brochure charts because they directly affect both cost and expected benefit.
When the analysis is transparent, the factory can make a better decision even if it chooses not to buy immediately. Good ROI work clarifies where the current process really loses money, which is valuable whether the project proceeds this quarter or later.
Punch press automation ROI is strongest when it is built from measured production losses, realistic recoverable savings, and a complete project cost model.
The most common error is not underestimating the machine. It is overestimating the benefit by skipping the hard work of baseline measurement. A good ROI model distinguishes between direct cash savings, capacity value, and strategic operational gains. It includes recurring cost, startup effects, and scenario analysis. And it remains believable even when assumptions are made more conservative.
If your team is evaluating a punch automation investment, the next step is simple: map where time and labor are lost today, quantify those losses, and test at least one conservative automation scenario. That discipline will make the eventual purchase decision far stronger, whether the answer is “invest now,” “re-scope,” or “wait.”
These FAQs address the practical questions that usually come up when management reviews an automation business case.
The best first metric is full system cycle time, because it reveals how much of the shift is lost outside the actual punching operation.
No. It should only be valued that way if the factory has demand and the punch process is a real bottleneck. Otherwise, a more conservative method such as avoided overtime may be better.
Two to four weeks is usually a practical minimum, provided the period reflects normal production and not a specially selected “good week.”
Commonly missed items include installation, layout changes, training, startup losses, software interfaces, and recurring maintenance or support cost.
At least three: conservative, expected, and upside. This helps management see how sensitive the project is to assumption changes.
Yes. In many factories, a targeted automation step that removes the biggest handling loss can produce a better return than an oversized full-line project.